Recently updated: September 27th, 2024
2024 will be a fast-paced digital world, making website performance even more important than before. A slow or poorly functioning website can drive visitors away, harm your search engine rankings, and ultimately impact your bottom line. To stay competitive, it’s essential to regularly monitor and optimize your website’s performance.
In this comprehensive guide, we will explore the top tools for measuring website performance metrics in 2024. We will cover both free and paid options, explain how to use these tools effectively and provide insights on interpreting the results.
Understanding the Basics of Website Performance
What Is Website Performance?
Website performance is all about how quickly and smoothly a website loads and works for visitors. It’s like the speed and efficiency of your site.
When we talk about performance, we are looking at how fast pages load, how quickly images appear, and how smoothly everything runs when people use your site.
Why Does Website Performance Matter?
Good website performance is crucial for several reasons:
- User Experience: Fast websites make visitors happy. If your site is slow, people might leave before they even see what you offer.
- Conversion Rates: Quick-loading pages often lead to more sales or sign-ups. People are more likely to stick around and do what you want them to do.
- Brand Perception: A smooth, fast site makes your brand look professional and trustworthy.
- Mobile Users: With more people using phones to browse, fast loading on mobile devices is super important.
- Search Engine Rankings: Search engines like Google prefer faster websites and may rank them higher in search results.
What Metrics Do You Need to Measure?
To understand your website performance, you need to look at several key metrics:
- Page Load Time: How long it takes for a page to fully load.
- Time to First Byte (TTFB): The time it takes for the browser to receive the first byte of data from the server.
- First Contentful Paint (FCP): When the first content (text, image, etc.) appears on the screen.
- Largest Contentful Paint (LCP): When the largest content element becomes visible.
- Cumulative Layout Shift (CLS): Measures visual stability and unexpected layout shifts.
- First Input Delay (FID): The time from when a user first interacts with your site to when the browser responds.
- Bounce Rate: The percentage of visitors who leave your site after viewing only one page.
Benefits of Measuring Website Performance
Keeping an eye on your website’s performance has several advantages:
- Identify Problems: You can spot issues before they become big problems for your users.
- Improve User Experience: By fixing performance issues, you make your site more enjoyable to use.
- Increase Conversions: Faster sites often lead to more sales or sign-ups.
- Save Resources: Efficient websites can reduce server costs and bandwidth usage.
- Stay Competitive: Understanding your performance helps you stay ahead of competitors.
13 Tools for Measuring Website Performance Metrics
1. Google PageSpeed Insights
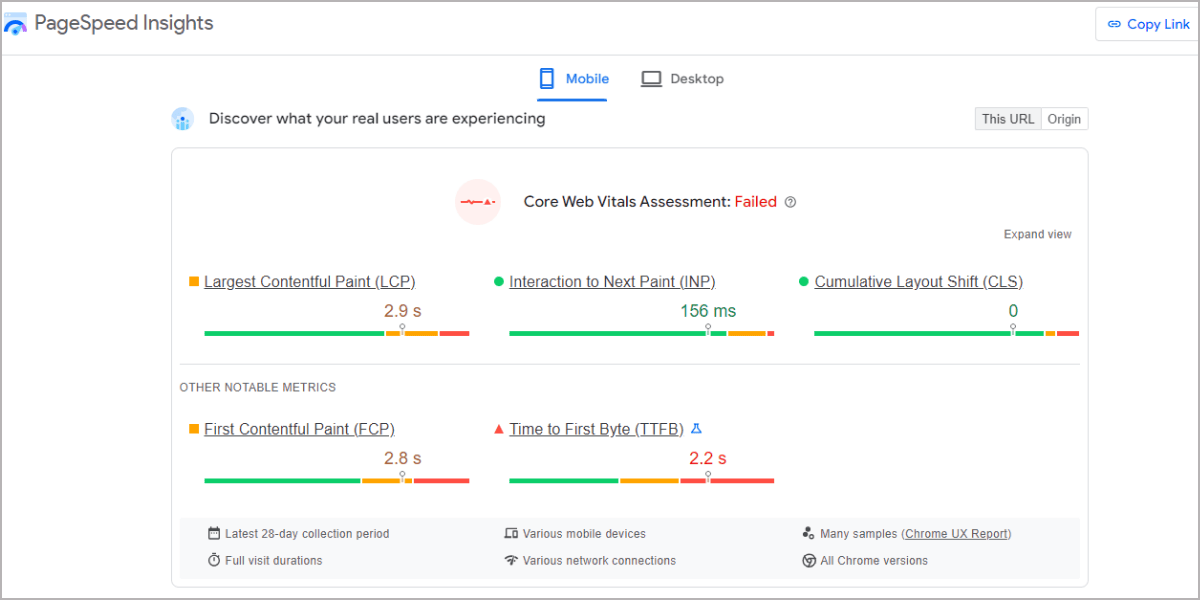
Google PageSpeed Insights will remain a go-to website performance measurement tool in 2024 due to its ease of use and valuable insights.
How it works:
To use PageSpeed Insights, simply enter your website’s URL into the tool. It then analyzes your page and provides separate scores for mobile and desktop performance, each out of 100 points.
Key metrics measured:
- First Contentful Paint (FCP): This measures how long it takes for the first piece of content to appear on the screen.
- Largest Contentful Paint (LCP): This indicates when the largest content element becomes visible.
- Total Blocking Time (TBT): This measures the total amount of time when the main thread is blocked, preventing input responsiveness.
- Cumulative Layout Shift (CLS): This quantifies how much-unexpected layout shift occurs during the loading of the page.
- Speed Index: This shows how quickly the contents of a page are visibly populated.
Pros:
- Free to use, making it accessible for businesses of all sizes.
- Provides actionable insights that can directly improve your site’s performance.
- Integrates seamlessly with other Google tools like Google Search Console.
2. GTmetrix

GTmetrix is a powerful website performance tool that offers a comprehensive analysis of your site’s speed and performance.
How it works:
Enter your URL into GTmetrix, and it will generate a detailed report on your site’s performance. GTmetrix uses both Google Lighthouse and YSlow to analyze your page, providing a holistic view of your site’s performance.
Key metrics measured:
- Fully Loaded Time: The total time it takes for your page to load completely.
- Total Page Size: The combined size of all resources on your page.
- Requests: The number of HTTP requests made to load your page.
- PageSpeed Score: A score based on Google’s PageSpeed recommendations.
- YSlow Score: A score based on Yahoo’s rules for high-performance websites.
Interpreting the results:
GTmetrix provides letter grades (A to F) for different aspects of your site’s performance. This makes it easy to quickly identify areas that need improvement. The tool also offers waterfall charts, which visualize the loading sequence of your page elements, helping you pinpoint bottlenecks.
One of GTmetrix’s standout features is its video playbacks of your page load. This allows you to see exactly how your page renders over time, which can be invaluable for identifying visual loading issues that metrics alone might miss.
Pros:
- Offers detailed reports that go beyond basic metrics.
- Provides visual aids like waterfall charts and video playbacks.
- Allows testing from different geographic locations, helping you understand global performance.
3. Pingdom
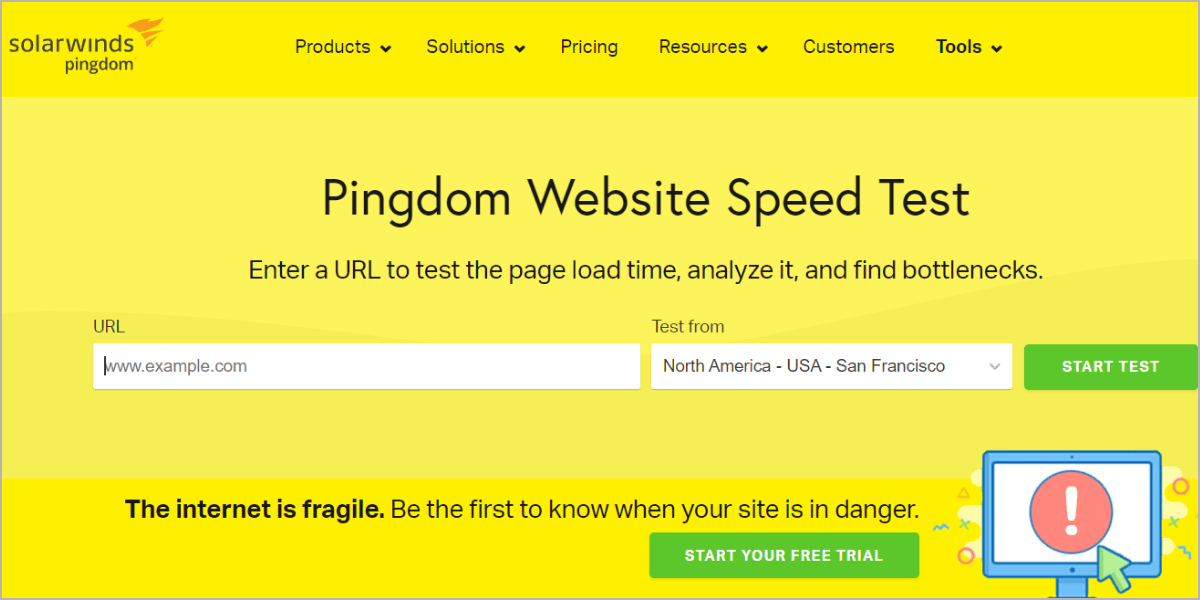
Pingdom is a versatile website monitoring tool that combines performance testing with uptime monitoring, making it a favorite among website owners and developers.
How it works:
To use Pingdom, enter your URL and select a test location. Pingdom will then analyze your site’s performance from that location, providing a detailed breakdown of load times and page size.
Key metrics measured:
- Load Time: The total time it takes for your page to load.
- Page Size: The total size of all elements on your page.
- Number of Requests: How many separate requests does your page make to the server?
- Performance Grade: An overall score based on various performance factors.
Interpreting the results:
Pingdom provides an overall performance grade and breaks down the load time for each element on your page. This granular view helps you identify which specific resources are slowing down your site. For example, you might discover that a particular image or script is taking an unusually long time to load.
The tool also provides a waterfall chart, showing the loading sequence of your page elements. This can help you identify render-blocking resources or inefficient loading orders.
Pros:
- A user-friendly interface that’s accessible to both beginners and experts.
- Offers real-time alerts for downtime, helping you quickly respond to issues.
- Provides historical data tracking, allowing you to monitor performance trends over time.
4. WebPageTest
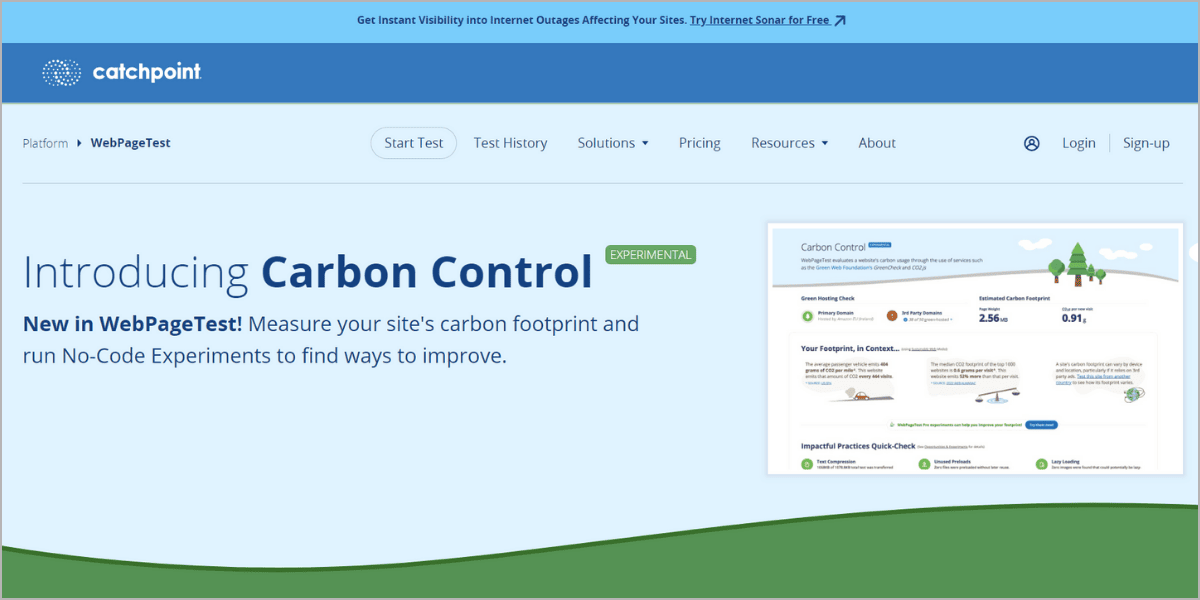
WebPageTest is a powerful, open-source website performance tool that offers advanced testing options for more technically inclined users.
How it works:
To use WebPageTest, enter your URL, choose a test location and browser, and set any advanced options you need. WebPageTest then runs multiple tests and provides a detailed analysis of your site’s performance.
Key metrics measured:
- First Byte Time: How long it takes for the first byte of data to be received from the server.
- Start Render: When the first non-white content appears on the screen.
- Speed Index: A score that indicates how quickly the page contents are visually populated.
- Fully Loaded Time: The time it takes for the page to be completely loaded.
- First Interactive: When the page becomes minimally interactive
Interpreting the results:
WebPageTest provides letter grades for various aspects of performance, making it easy to quickly identify areas for improvement. It also offers in-depth technical information, including waterfall charts, video captures of page loads, and detailed breakdowns of each request made by your page.
One of WebPageTest’s unique features is its ability to simulate different network conditions. This allows you to see how your site performs at various connection speeds, which is crucial for optimizing for mobile users or those in areas with slower internet.
Pros:
- Offers highly customizable tests, allowing for specific scenario testing.
- Provides extremely detailed technical information for in-depth analysis.
- It is free to use, making it accessible to all.
5. Lighthouse (Chrome DevTools)
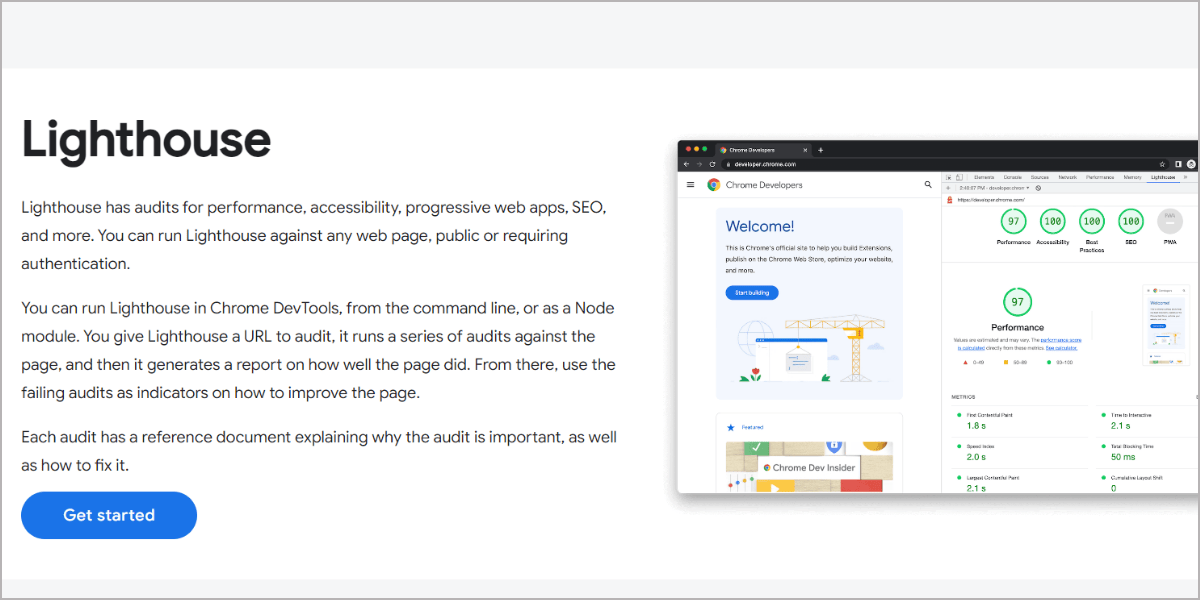
Lighthouse is an open-source tool developed by Google that’s built into Chrome DevTools, making it a convenient option for developers who want to quickly analyze their site’s performance.
How it works:
To use Lighthouse, open Chrome DevTools (usually by pressing F12), navigate to the Lighthouse tab, and run an audit. Lighthouse will analyze your page and provide scores for performance, accessibility, best practices, and SEO.
Key metrics measured:
- First Contentful Paint: When the first content appears on the screen.
- Speed Index: How quickly the contents of a page are visibly populated.
- Largest Contentful Paint: When the largest content element becomes visible.
- Time to Interactive: How long it takes for the page to become fully interactive.
- Total Blocking Time: The total amount of time when the main thread was blocked.
Interpreting the results:
Lighthouse provides scores out of 100 for each category it tests. These scores are color-coded (red, orange, and green) for quick visual assessment. The tool also offers specific recommendations for improving your scores, complete with links to relevant documentation.
One of Lighthouse’s strengths is its holistic approach. Beyond just performance, it also evaluates accessibility and SEO, giving you a comprehensive view of your site’s health.
Pros:
- Free and easily accessible, being built into Chrome.
- Provides a holistic view of website health, beyond just performance.
- Offers actionable recommendations with links to implementation guides.
6. WAVE Web Accessibility Evaluation Tool
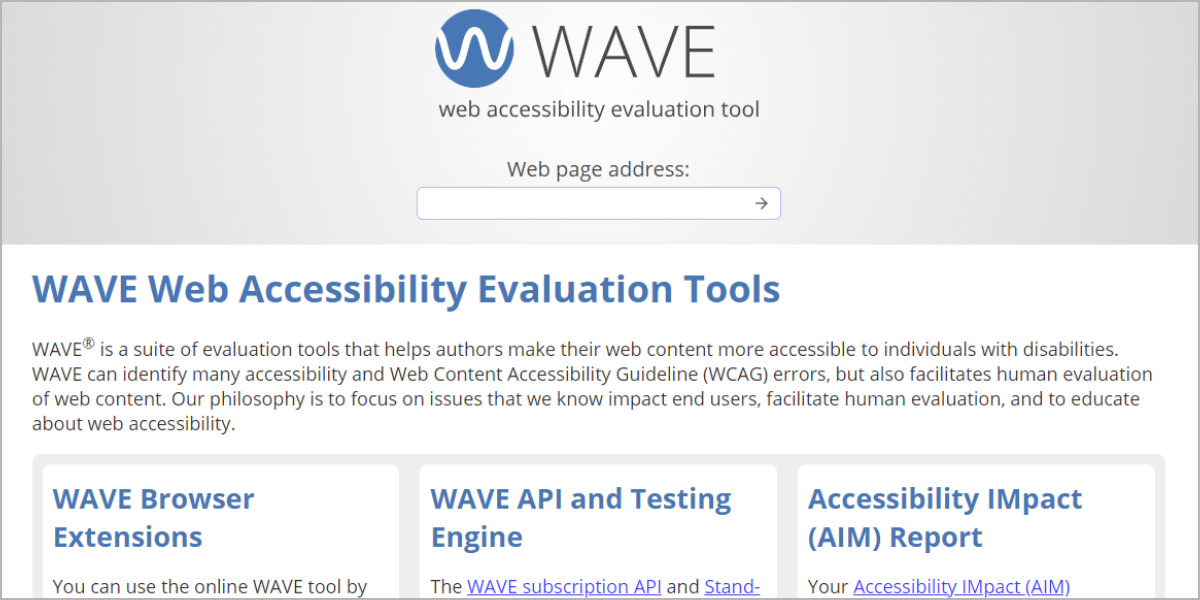
WAVE (Web Accessibility Evaluation Tool) is a suite of evaluation tools that helps authors make their web content more accessible to individuals with disabilities.
How it works:
WAVE can be used in several ways:
- As a web-based tool where you input a URL.
- As a browser extension for Chrome and Firefox.
- As an API for developers to integrate into their workflows.
Once activated, WAVE analyzes the web page and provides a detailed report on accessibility issues.
Key features and metrics:
- Structural elements: identifies headings, lists, tables, and other structural elements.
- ARIA (Accessible Rich Internet Applications) usage: Checks for proper implementation of ARIA attributes.
- Color contrast: Evaluates text color against background color for readability.
- Alternative text: Checks for the presence and quality of alt text for images.
- Form labels: Ensures form elements are properly labeled.
- Keyboard accessibility: Verifies that all functionality is accessible via the keyboard.
Interpreting the results:
WAVE uses icons overlaid on your web page to highlight issues and good practices. It categorizes issues into:
- Errors: Critical accessibility problems
- Alerts: Potential accessibility issues
- Features: Elements that enhance accessibility
- Structural Elements: Page structure indicators
- HTML5 and ARIA: Usage of these technologies
Pros:
- Free to use for basic functionality.
- Provides visual feedback directly on the web page.
- Offers detailed explanations for each issue found.
7. SEO Site Checkup
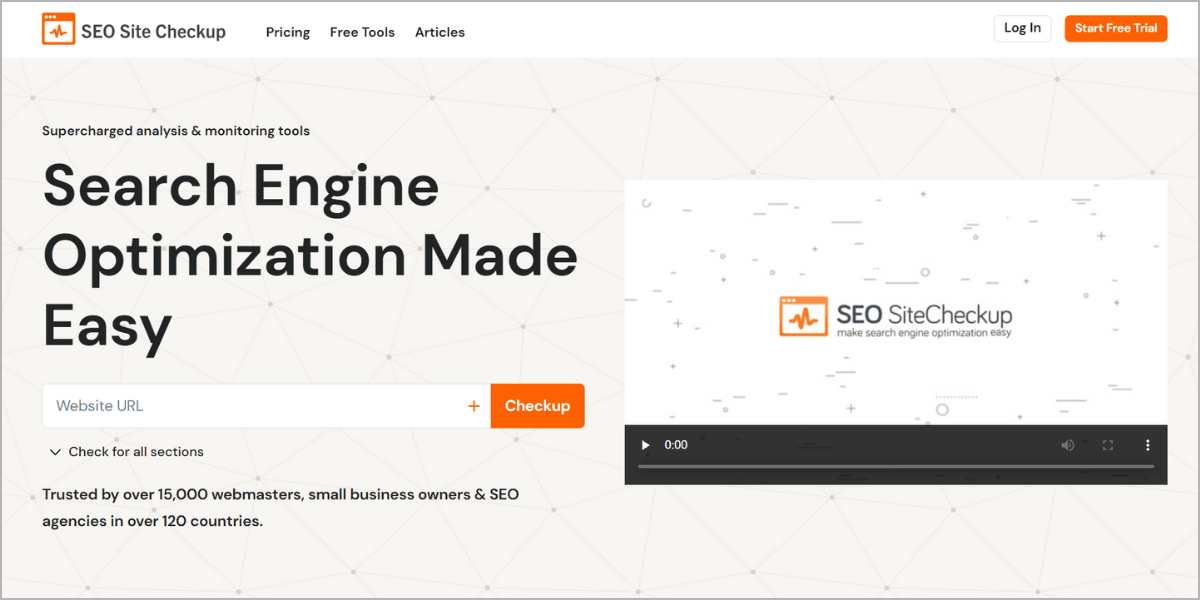
SEO Site Checkup is a comprehensive SEO analysis tool that also includes some performance metrics relevant to search engine optimization.
How it works:
Enter your website URL into SEO Site Checkup, and it will analyze various aspects of your site’s SEO, including some performance-related factors.
Key features and metrics:
- Page speed analysis: Checks load time and page size.
- Server and security checks: Verify HTTPS usage and safe browsing status.
- Mobile-friendliness: Assesses how well your site works on mobile devices.
- Meta tag analysis: Checks title tags, meta descriptions, and headers.
- Content analysis: Evaluates keyword usage and content quality.
- Backlink analysis: Provides an overview of your site’s backlink profile.
Interpreting the results:
SEO Site Checkup provides an overall score out of 100, as well as individual scores for different categories. It offers a checklist of issues to address, prioritized by importance.
The tool provides explanations for each check it performs, helping you understand why each factor is important for SEO. It also offers suggestions for how to fix any issues it identifies.
Pros:
- Provides a comprehensive SEO analysis, including performance factors.
- Offers actionable recommendations for improvement.
- Easy to understand, even for those new to SEO.
8. Uptrends
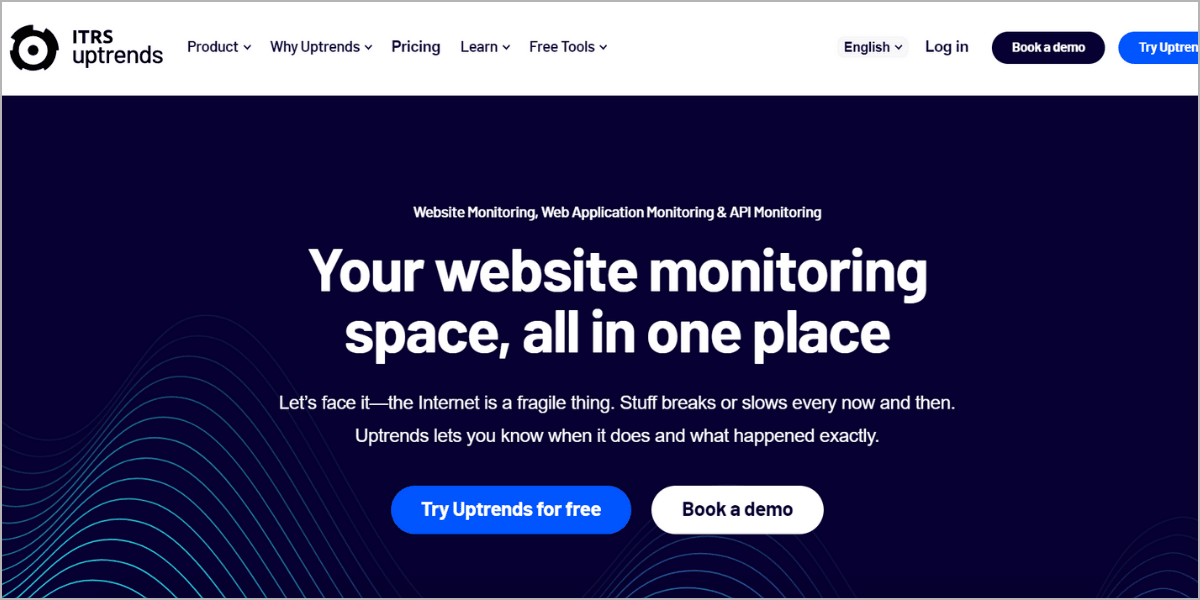
Uptrends is a comprehensive website monitoring service that offers a wide range of tools for tracking website performance and availability.
How it works:
Uptrends offers several monitoring services. For performance monitoring, you can set up regular tests from multiple locations worldwide. These tests simulate user interactions with your site and measure various performance metrics.
Key features and metrics:
- Uptime monitoring: Check if your website is accessible.
- Full page check: Measures load time for all elements on a page.
- Transaction monitoring: Tests multi-step processes like checkouts.
- Real User Monitoring (RUM): Collects performance data from actual site visitors.
- Web application monitoring: Checks the functionality of web applications.
- API monitoring: Ensures your APIs are performing correctly.
Key performance metrics include:
- DNS time: How long it takes to look up your domain.
- Connect time: Time to establish a connection to your server.
- Send time: How long does it take to send the request to your server?
- Wait time: Time waiting for the first byte of the response.
- Receive time: How long does it take to download the response?
Interpreting the results:
Uptrends provides detailed dashboards and reports for each type of monitoring. For performance tests, you will see waterfall charts showing the load sequence of page elements, as well as trends over time.
The tool allows you to set up alerts based on performance thresholds, so you can be notified immediately if your site’s performance degrades.
Pros:
- Offers a comprehensive suite of monitoring tools.
- Provides testing from multiple global locations.
- Includes both synthetic testing and real-user monitoring.
9. Google Search Console
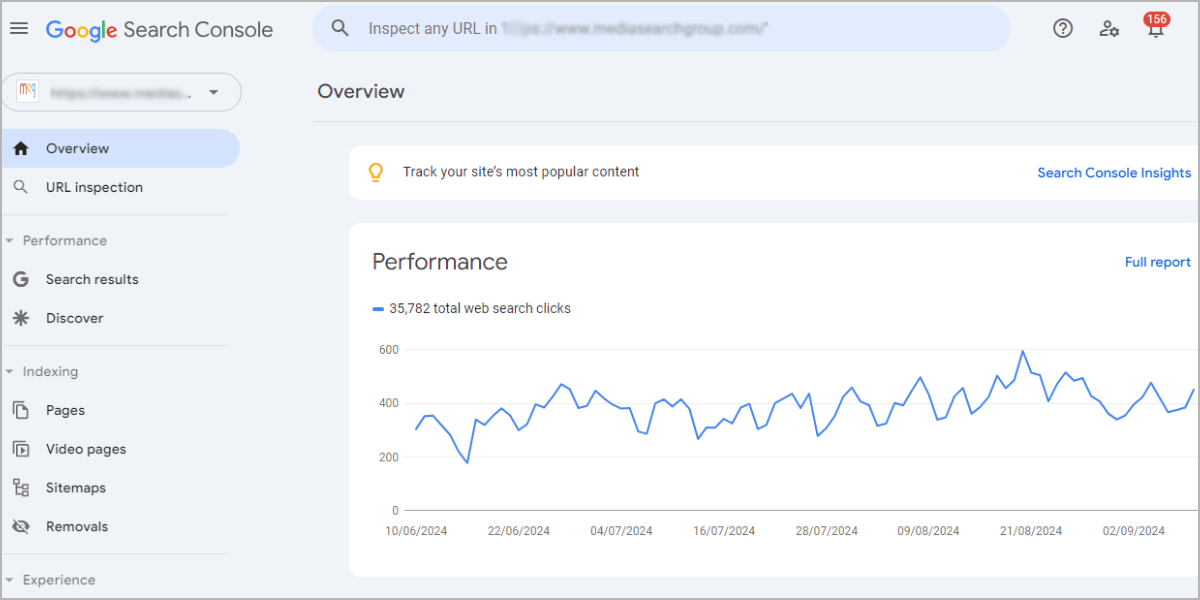
Google Search Console is a free web service by Google that’s essential for website owners and SEO professionals. It’s like a dashboard that shows you how your site performs in Google Search results.
How it works:
Google Search Console is a free web service provided by Google that helps website owners monitor, maintain, and troubleshoot their site’s presence in Google Search results. It provides valuable insights into how Google views your site and how it performs in search results.
Key features and metrics:
- Search performance analysis
- Index coverage report
- Mobile usability check
- Core Web Vitals monitoring
- Security issues detection
- Structured data testing
- URL inspection tool
- Links report (internal and external)
Key performance metrics include:
- Click-through rate (CTR)
- Average position in search results
- Impressions
- Total clicks
- Core Web Vitals (Largest Contentful Paint, First Input Delay, Cumulative Layout Shift)
Interpreting the results:
Google Search Console provides a wealth of data that can be used to improve your site’s search performance and overall user experience. Pay close attention to:
- Search queries drive traffic to your site.
- Pages with high impressions but low CTR (potential for optimization.)
- Core Web Vitals issues that need addressing.
- Mobile usability problems.
- Indexing issues that may be preventing your content from appearing in search results.
Use these insights to make data-driven decisions about content optimization, technical improvements, and overall site strategy.
Pros:
- A free and comprehensive tool from Google.
- Directly reflects how Google sees and interacts with your site.
- Provides actionable insights for SEO and performance improvements.
- Integrates well with other Google services (e.g., Google Analytics).
10. Dotcom-Monitor
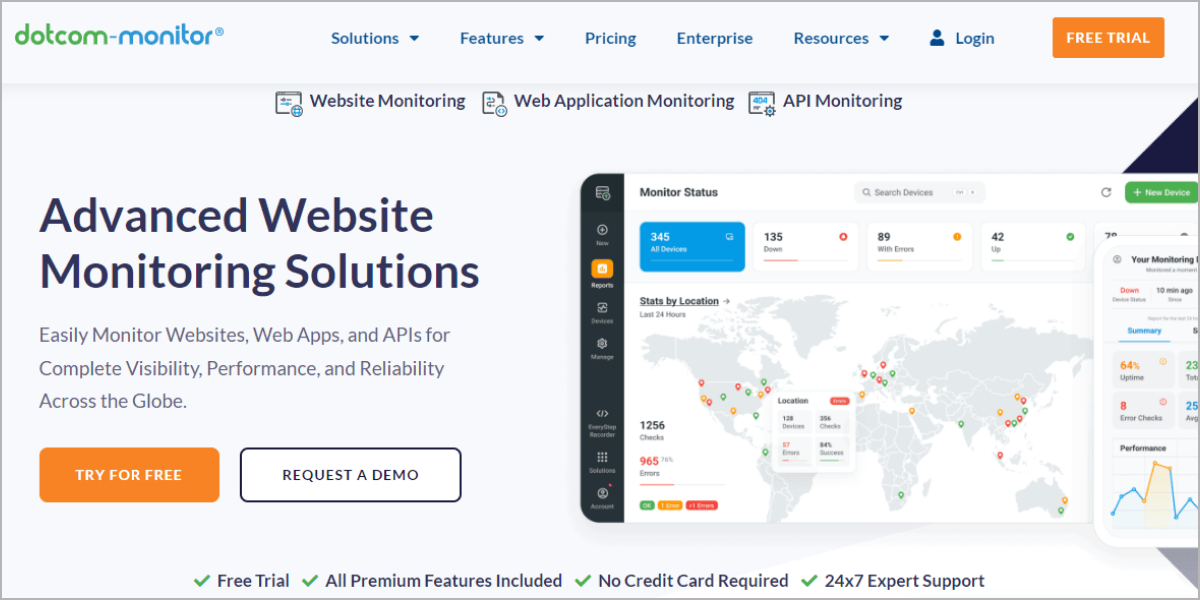
Dotcom-Monitor is a comprehensive website monitoring platform. Think of it as a global network of virtual users constantly checking your website’s performance.
How it works:
Dotcom-Monitor is a comprehensive website monitoring and performance testing platform. It uses a global network of servers to simulate user interactions with your website from various locations, devices, and network conditions.
Key features and metrics:
- Website uptime monitoring
- Full-page load testing
- Transaction monitoring
- Real browser testing
- API monitoring
- SSL certificate monitoring
- Custom alert settings
- Detailed reporting and analytics
Key performance metrics include:
- Response time
- Time to First Byte (TTFB)
- Page load time
- DNS lookup time
- Connection time
- SSL handshake time
- Content download time
- Uptime percentage
Interpreting the results:
Dotcom-Monitor provides detailed reports and visualizations to help you understand your website’s performance across different scenarios. Focus on:
- Identifying performance bottlenecks in specific geographic locations.
- Understanding how your site performs on different devices and browsers.
- Analyzing the impact of third-party services on your site’s performance.
- Monitoring critical user journeys and transactions.
- Tracking performance trends over time to identify degradation or improvements.
Use these insights to prioritize optimization efforts and ensure consistent performance across all user segments.
Pros:
- Comprehensive monitoring solution covering various aspects of website performance.
- Global testing network for accurate, location-specific insights.
- Real browser testing for a more accurate representation of user experience
11. KeyCDN Website Speed Test
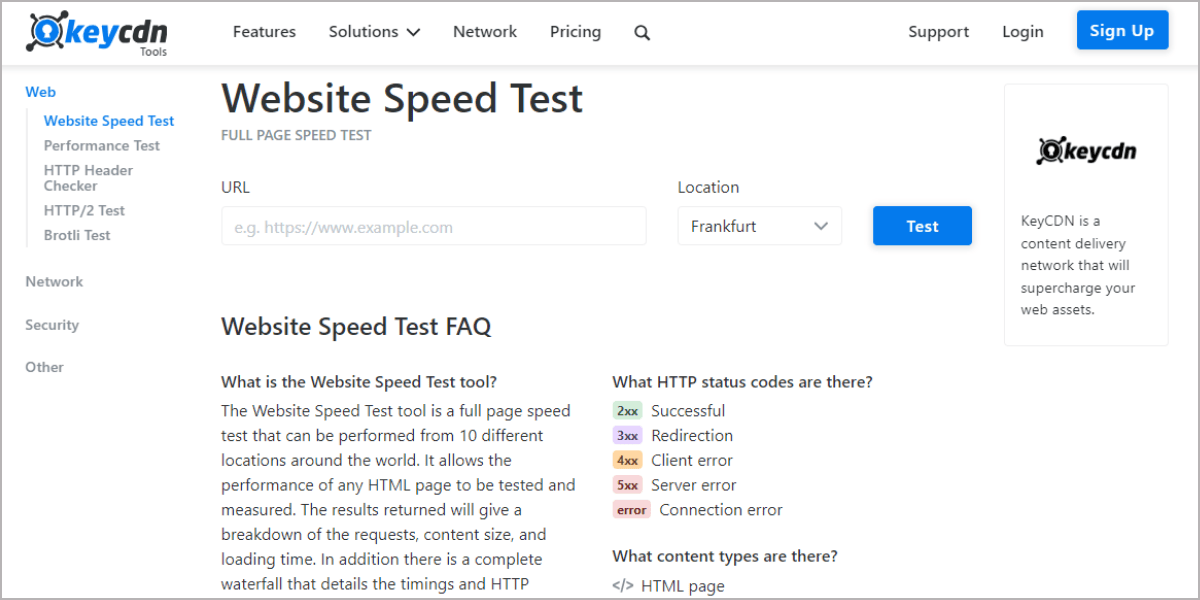
This is a free online tool that focuses specifically on your website’s loading speed. It’s like having a stopwatch that measures various aspects of your site’s load time.
How it works:
KeyCDN’s Website Speed Test is a free online tool that allows you to test your website’s loading speed from multiple locations around the world. It uses real browsers to load your site and provides detailed performance metrics and recommendations.
Key features and metrics:
- Multi-location testing
- Waterfall chart of asset loading
- Performance grade
- Optimization suggestion
- Header response analysis
- Content breakdown by type
- Comparison of first view vs. repeat view
Key performance metrics include:
- Overall load time
- Time to First Byte (TTFB)
- Start render time
- DOM interactive time
- DOM content loaded time
- Document complete time
- Fully loaded time
- Total page size
- Number of requests
Interpreting the results:
KeyCDN’s speed test provides a comprehensive overview of your site’s performance. Pay attention to:
- Differences in load times across various locations.
- Assets that are taking the longest to load (visible in the waterfall chart).
- Performance grades for different aspects of your site.
- Specific optimization recommendations are provided.
- Differences between first view and repeat view performance.
Use this information to identify and address performance issues, optimize asset delivery, and improve caching strategies.
Pros:
- Free and easy to use
- Tests from multiple global locations
- Provides detailed performance metrics and visualizations
12. Yellow Lab Tools

Yellow Lab Tools is an open-source performance analysis tool. It’s like having a web performance expert analyze your site and give you a detailed report.
How it works:
Yellow Lab Tools is an open-source web performance analysis tool that audits web pages and provides detailed reports on various performance aspects.
It runs multiple tests on your web page and generates scores and recommendations based on best practices.
Key features and metrics:
- Performance budget tracking
- JavaScript execution analysis
- CSS complexity assessment
- DOM size and complexity analysis
- Image optimization check
- Server configuration analysis
- Third-party scripts impact assessment
Key performance metrics include:
- Global score
- Number of DOM elements
- Number of CSS rules
- JavaScript execution time
- Number of HTTP requests
- Total page weight
- Image optimization score
- CSS complexity score
Interpreting the results:
Yellow Lab Tools provides a detailed breakdown of various performance aspects. Focus on:
- The global score and individual scores for different categories.
- Specific rules that are being violated and their impact on performance.
- JavaScript execution time and potential optimizations.
- CSS complexity and opportunities for simplification.
- Image optimization recommendations.
Use these insights to prioritize optimization efforts, focusing on the areas that will have the most significant impact on your site’s performance.
Pros:
- Open-source and free to use.
- Provides unique insights into CSS and JavaScript complexity.
- Offers specific, actionable recommendations
13. Semrush Site Audit
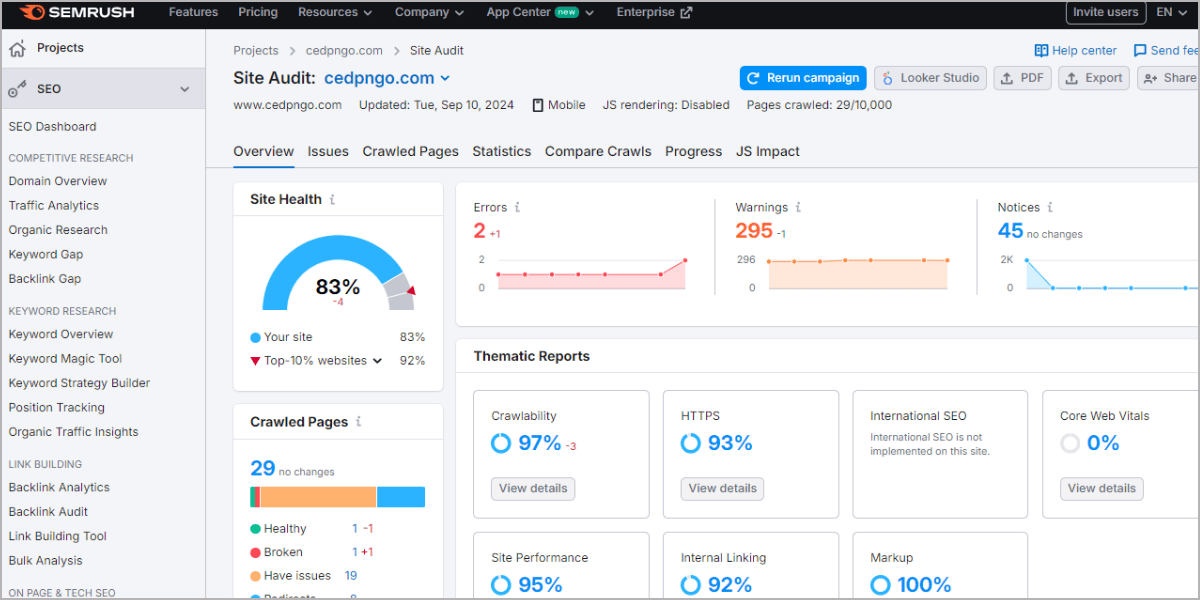
While Semrush is known primarily as an SEO tool, its Site Audit feature includes comprehensive performance analysis. It’s like having an SEO expert and a performance analyst review your site together.
How it works:
While primarily known as an SEO tool, Semrush’s Site Audit feature includes comprehensive website performance analysis.
It crawls your website, analyzes various technical and performance aspects, and provides detailed reports and recommendations.
Key features and metrics:
- Comprehensive site crawl and analysis
- Core Web Vitals assessment
- Page speed analysis
- Mobile-friendliness check
- HTTPS implementation audit
- Internal linking structure analysis
- Crawl budget optimization
- International SEO checks
Key performance metrics include:
- Overall site health score
- Core Web Vitals metrics (LCP, FID, CLS)
- Page load time
- Time to First Byte (TTFB)
- Number of slow pages
- Mobile responsiveness score
- HTTPS implementation score
- Crawl depth
Interpreting the results:
Semrush Site Audit provides a holistic view of your website’s technical health and performance. Pay attention to:
- The overall site health score and how it changes over time.
- Core Web Vitals issues and affected pages.
- Slow-loading pages and potential causes.
- Mobile friendliness issues.
- HTTPS implementation problems
Use these insights to create a comprehensive optimization plan that addresses both performance and technical SEO aspects of your site.
Pros:
- Combines performance analysis with comprehensive technical SEO audit.
- Provides actionable recommendations for improvement.
- Allows for tracking of progress over time.
- Integrates with other Semrush tools for a complete digital marketing analysis.
Choose the Right Tool Invesed for the Best Website Performance
Measuring and improving your website’s performance is crucial for success in today’s digital landscape. The tools we have discussed offer a range of options for monitoring and analyzing your site’s performance, from free, easy-to-use options like Google PageSpeed Insights to comprehensive solutions like Uptrends.
Remember, the key is not just to measure your performance but to use these insights to make meaningful improvements. Regularly monitor your metrics, set performance goals, and work continuously to enhance your site’s speed and user experience.